
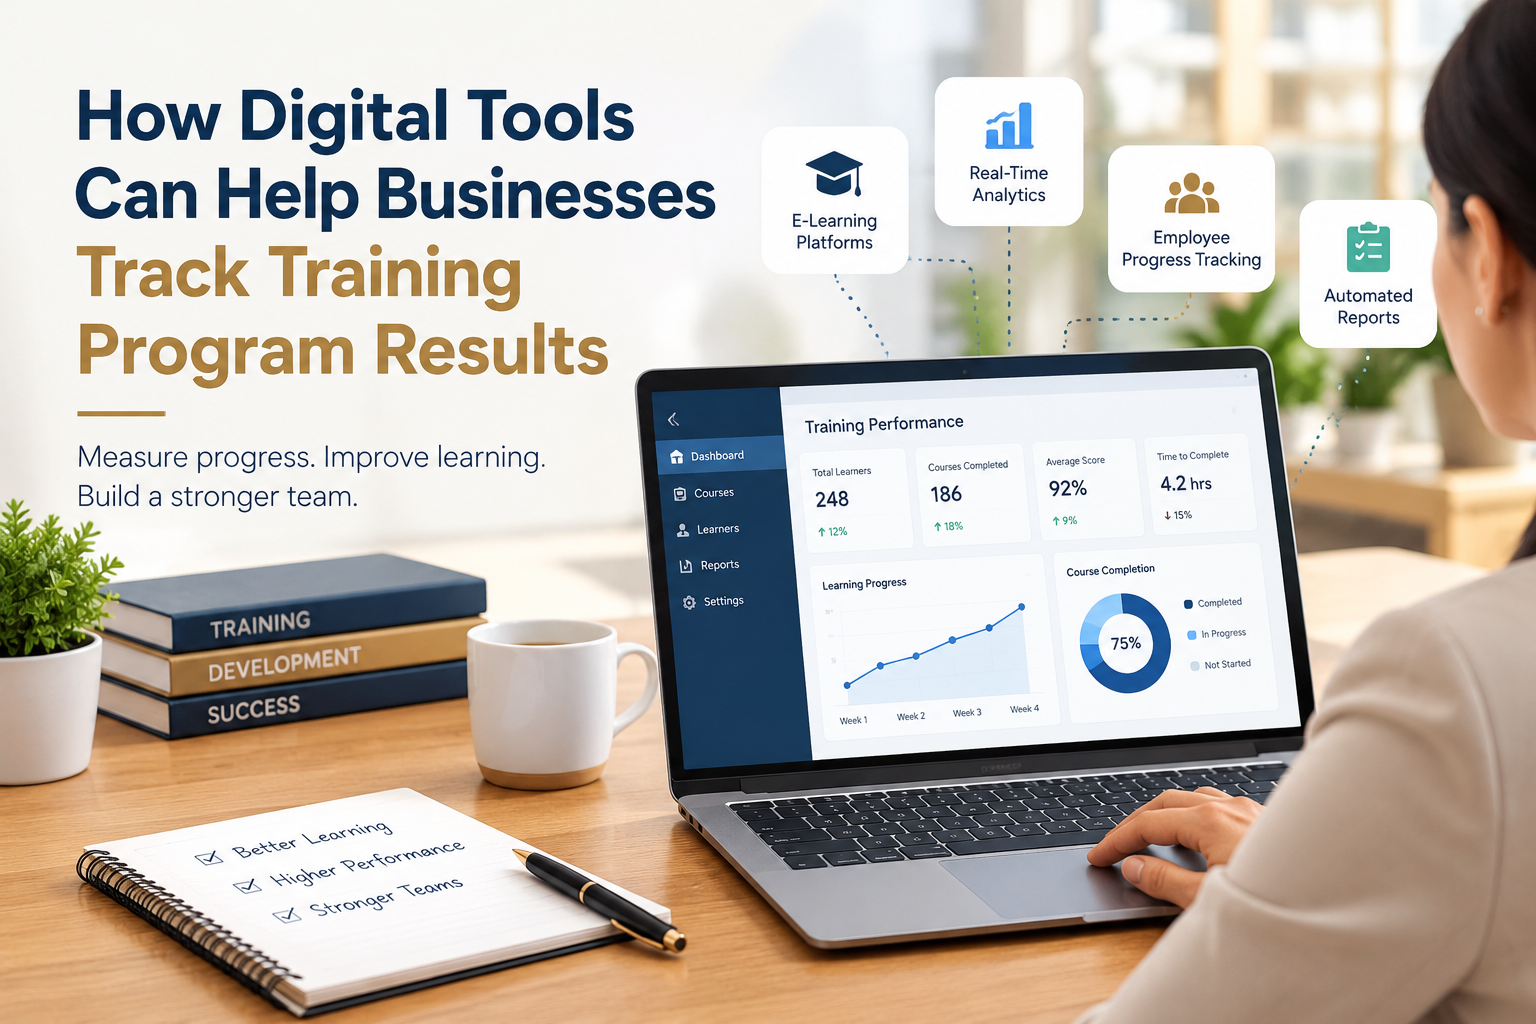
Ask a department head how last quarter’s training went and you will usually get a feeling rather than a figure. People seemed engaged. Attendance was decent. Somebody mentioned the session on data handling was useful. That is the entire evidence base behind a line item that can run well into six figures, and it would not survive the scrutiny any company applies to a software renewal or an ad spend.
Digital learning tools changed the terms of that conversation, mainly because they log things. Every module opened, every assessment submitted, every certificate issued leaves a record, and those records can be queried instead of guessed at. The shift is less about handsome dashboards than about finally having a denominator.
Raw data is still not insight, though. A platform will cheerfully report a 94 percent completion rate while the skill the course existed to build goes nowhere near the job. Getting something out of learning analytics means knowing which numbers deserve attention, reading them against each other rather than one at a time, and being willing to change the course when they say something unflattering.
The Metrics That Earn Their Place on a Report
Completion rate is the figure everyone reaches for first and the weakest of the ones worth having. It tells you whether people could find the course, whether the deadline landed in a sane week, and whether managers actually backed the initiative. Those are logistics. They matter for mandatory compliance work, where the record is the deliverable, but a full completion bar says nothing about whether anybody can now work differently.
Assessment scores get closer, provided you read the change rather than the result. A post-course average of 82 percent means very little by itself; an average that moved from 54 percent to 82 percent is a finding. Pre-tests feel like friction to learners, and they are worth the friction, because without a baseline you cannot separate what the course taught from what the group already knew.
Participation data is where these tools do something a classroom never could. Time inside a module, the exact point a video gets abandoned, which resources people come back to three weeks later, how many learners post in a discussion instead of lurking. Together they sketch where attention held and where it leaked, which is usually the first honest clue about what needs rebuilding. Shaping a training program around that kind of evidence is a very different exercise from shaping one around a syllabus.
Reading Scores as a Map of Knowledge Gaps
Aggregate scores hide the interesting part. Drop to the item level and patterns surface quickly: when 60 percent of a cohort misses the same question about escalation thresholds, you have either a content gap or a badly worded question, and both are cheap to fix once identified.
Slice the same results by team, site or shift and a second layer appears. Night shift scoring fifteen points under days seldom means night shift is less capable; more often it means they took the module at three in the morning between tasks. Regional gaps frequently trace back to a local process the central course never acknowledged. Neither conclusion is available from a company-wide average, and both change what you build next.
Standards Are What Keep the Data Usable
Tracking only compounds when the records survive a change of vendor. Older course packages reported little more than a score and a completion flag, which is why the industry moved toward richer event data, formalized as the IEEE standard for learner experience data tracking built on the xAPI specification. The practical effect is that learning activity gets captured as discrete statements in a learning record store, so a simulation, a coaching session or an on-the-job observation can all land in the same evidence base as a quiz.
It also lets learning data join the rest of the stack. Plenty of the signals you want sit in adjacent systems already, which is one reason training reporting is increasingly treated as part of the wider set of HR technology tools rather than a private corner of the learning team.
Connecting Learning Data to Business Outcomes
The hard question is not whether people learned, it is whether anything downstream moved. The Kirkpatrick Model has organized that question for decades across four levels, reaction, learning, behavior and results, with the recommendation that you define the result you are after before designing a single slide. Work backward from the outcome and your metrics choose themselves.
In practice this means pairing learning records with operational data nobody in the learning team owns. First-contact resolution for a support group that went through a new product course. Error rates on the line after a procedure refresher. Ramp time to full productivity for new hires on a revised onboarding path. The correlation will never be clean, but a consistent movement in the right metric is a far stronger case than a satisfaction score.
Be honest about attribution when you report it. Claiming a course drove a revenue number invites the finance team to take it apart, and they will. Showing that the behaviors you targeted appear more often, and that the outcome tied to those behaviors improved, is more defensible and more useful.
Start with one program that matters and one outcome it is supposed to affect. Define the outcome first, add a pre-test so the delta means something, read item-level results rather than averages, and compare cohorts instead of lumping everyone together. Then do the unglamorous part: change something in the course based on what you found, and run it again.
Two cycles of that will tell you more about your training than another year of completion reports. It also shifts the conversation with leadership, because you are no longer defending a budget with anecdotes, you are reporting on a program with evidence.

Senior SEO Content Marketing Manager at Trendusai.com
Rashida Hanif is a Senior SEO Content Marketing Manager, specializing in data-driven content strategy and SEO. She helps brands improve online visibility through keyword research, content planning, and AI-powered marketing insights.